How many accountants are there in Belgium, where are they based, since when, how large are their firms and how healthy are they? No public source answers these questions in one place. So we did the count ourselves, using the Crossroads Bank for Enterprises, the annual accounts filed with the National Bank, Statbel's population and income statistics and the ITAA's annual reports. This is the panorama of the Belgian accounting profession in 2026, in figures and maps.
The key facts in ten figures
- 11,250 active accounting and tax firms in Belgium, excluding statutory auditors: 8,811 companies and 2,439 self-employed professionals working as sole traders.
- 1 firm per 1,055 inhabitants on the national average, or about 9.5 firms per 10,000 inhabitants.
- 57.3% of firms are in Flanders, 31.2% in Wallonia and 11.6% in Brussels, almost exactly each region's share of the population.
- 15.8 firms per 10,000 inhabitants in Walloon Brabant, against 4.7 in the province of Luxembourg: a ratio of 1 to 3.4.
- 28.1 firms per 10,000 inhabitants in Herve, the densest municipality in the country among those with more than 10,000 inhabitants.
- 17 municipalities out of 565 have no accounting firm based on their territory, 8 of them in the province of Luxembourg.
- 42% of the firms active today started in 2015 or later, and 2025 is the year in which the most were created (582).
- 2.3 full-time equivalents: the median size of firms that publish a social balance sheet.
- €74,600 median profit for accounting companies whose accounts are published, and only 5.4% of them are loss-making.
- 10,940 individual professionals registered with the ITAA on 1 January 2026, of whom 8,959 work for clients.
How many accountants are there in Belgium?
The question seems simple. Yet it has two correct answers, because two different things can be counted: the businesses that carry out accounting work, or the people who hold a professional title.
Counting firms: 11,250 active businesses
Every Belgian business is registered with the Crossroads Bank for Enterprises under an activity code. Codes 69.201 to 69.203 cover accounting and tax activities as well as statutory audit. In June 2026, 12,259 active businesses declared one of these as their main activity.
We removed three categories to obtain a clean figure:
- the 50 VAT units, which group companies for tax purposes that are already counted separately;
- the 53 businesses in bankruptcy, liquidation, dissolution or judicial reorganisation;
- the 906 statutory audit firms, which belong to a different profession, a different institute (the IRE/IBR) and a different mission, the statutory audit of accounts.
That leaves 11,250 active accounting and tax firms. Of these, 8,811 are companies and 2,439 are self-employed professionals working as sole traders, under their own enterprise number.
Counting professionals: 10,940 ITAA members
The other way of counting starts from titles. In Belgium, the titles of accountant and tax adviser are protected: only a professional registered with the ITAA may use them. On 1 January 2026, the institute had 10,940 individual members and 2,475 trainees. Of the members, 8,959 are registered as external, meaning they work for clients, and 1,981 as internal, working for a single organisation.
The ITAA also recognises 9,188 legal entities, the companies through which its members practise. That figure is very close to the 8,811 accounting companies we count in the Crossroads Bank, which confirms that both sources describe the same population.
| Indicator | Value | Source |
|---|---|---|
| Active accounting and tax firms | 11,250 | CBE, June 2026 |
| of which companies | 8,811 | CBE, June 2026 |
| of which sole traders | 2,439 | CBE, June 2026 |
| Statutory audit firms (excluded) | 906 | CBE, June 2026 |
| Individual ITAA members | 10,940 | ITAA, 1 January 2026 |
| of which external members | 8,959 | ITAA, 1 January 2026 |
| ITAA trainees | 2,475 | ITAA, 1 January 2026 |
| Legal entities recognised by the ITAA | 9,188 | ITAA, 1 January 2026 |
The two figures cannot be added together. A firm can bring together several professionals, and a professional often practises through their own company, which may itself be a partner in a larger firm. The right reading is this: about 11,000 practices and about 9,000 qualified professionals serving clients, plus the unqualified staff who do a large share of the production work.
The map of accounting firms
Before the ratios, a picture. Each dot below is the registered office of an accounting company, 8,759 geolocated companies in all. Sole traders are not shown, so as not to map private addresses.
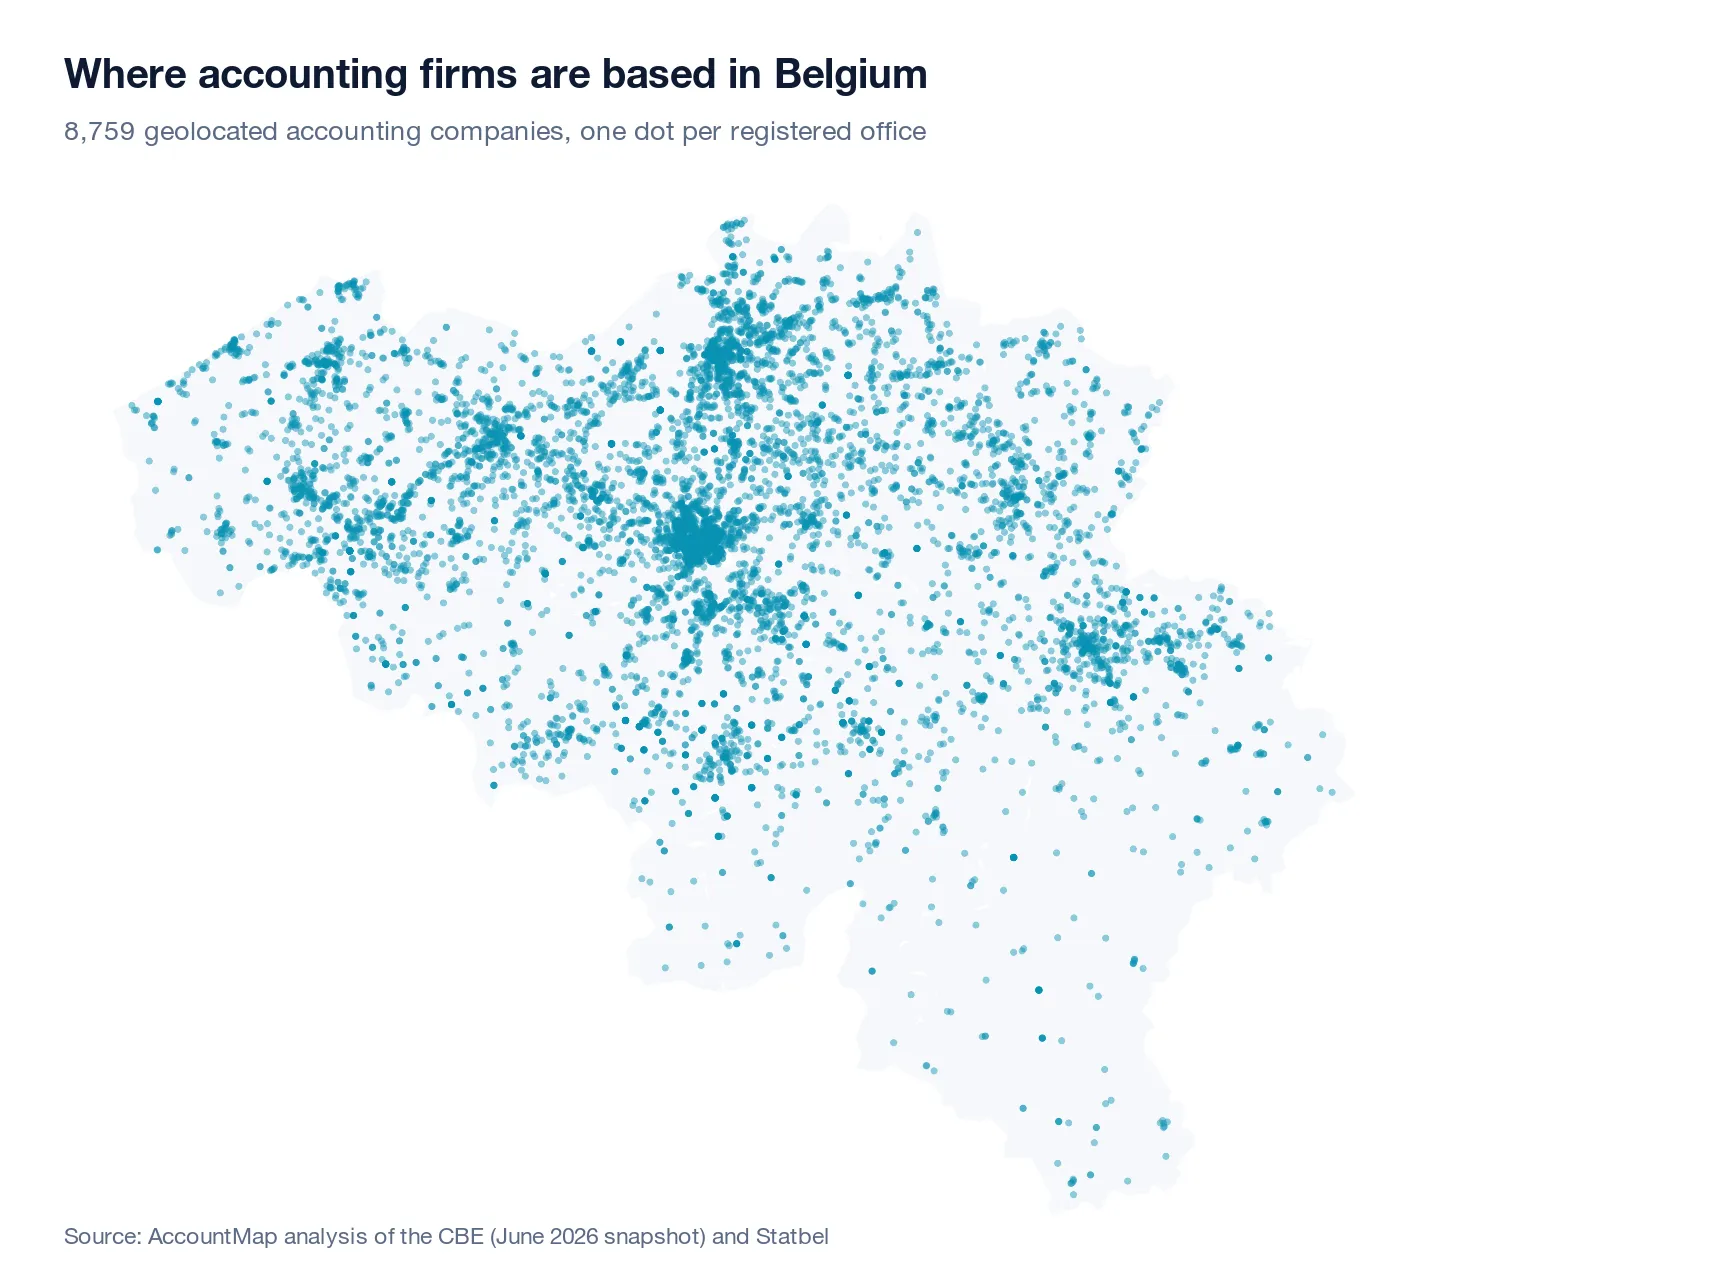
The map traces the country's main economic areas: a dense cluster around Brussels spilling into Walloon and Flemish Brabant, the Antwerp, Ghent and Liège conurbations, a tight mesh in West Flanders and the Lys valley, then a much looser network in the south of the Entre-Sambre-et-Meuse and in the Ardennes.
Above all, it shows that there is no real "accounting desert": even in the least dense areas, a firm is rarely more than a few kilometres away. The real differences appear when the number of firms is set against the population.
The regions: supply that mirrors the population
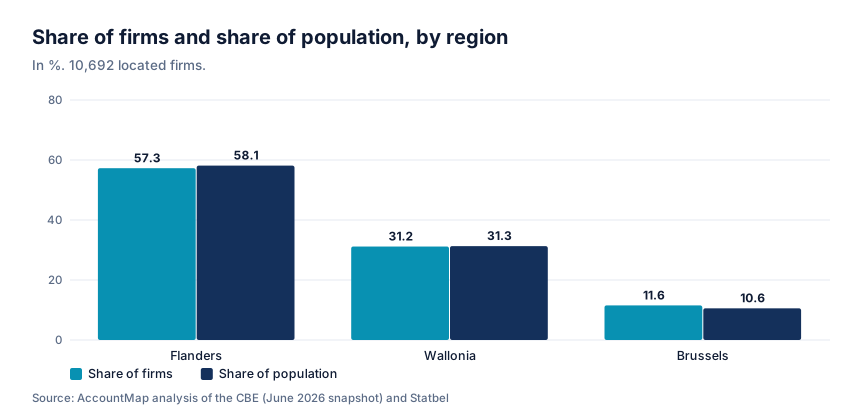
To compare areas, we linked each firm to its municipality, using the registered office address for companies and the establishment address for sole traders. 10,692 firms could be located this way, which gives a national average of 9.0 firms per 10,000 inhabitants.
| Region | Located firms | Share of firms | Share of population | Firms per 10,000 inh. | Inhabitants per firm |
|---|---|---|---|---|---|
| Flanders | 6,124 | 57.3% | 58.1% | 8.9 | 1,126 |
| Wallonia | 3,333 | 31.2% | 31.3% | 9.0 | 1,114 |
| Brussels | 1,235 | 11.6% | 10.6% | 9.8 | 1,017 |
| Belgium | 10,692 | 100% | 100% | 9.0 | 1,110 |
This is the first finding, and it is counter-intuitive: at regional level, accounting supply follows the population almost perfectly. Wallonia accounts for 31.3% of inhabitants and 31.2% of firms. Flanders for 58.1% and 57.3%. Brussels is slightly above, explained by the concentration of registered offices and economic activity in the capital.
The density of client businesses is therefore not the only driver: the profession remains a local service, spread roughly like the population. The gaps widen at a finer scale.
The provinces: from Walloon Brabant to Luxembourg
| Province | Firms | Population | Firms per 10,000 inh. | Inhabitants per firm |
|---|---|---|---|---|
| Walloon Brabant | 658 | 416,947 | 15.8 | 634 |
| Brussels-Capital | 1,235 | 1,255,834 | 9.8 | 1,017 |
| Namur | 495 | 506,271 | 9.8 | 1,023 |
| West Flanders | 1,182 | 1,235,671 | 9.6 | 1,045 |
| Flemish Brabant | 1,118 | 1,210,797 | 9.2 | 1,083 |
| East Flanders | 1,421 | 1,611,409 | 8.8 | 1,134 |
| Liège | 986 | 1,125,300 | 8.8 | 1,141 |
| Antwerp | 1,687 | 1,931,891 | 8.7 | 1,145 |
| Limburg | 716 | 908,582 | 7.9 | 1,269 |
| Hainaut | 1,056 | 1,368,562 | 7.7 | 1,296 |
| Luxembourg | 138 | 296,370 | 4.7 | 2,148 |
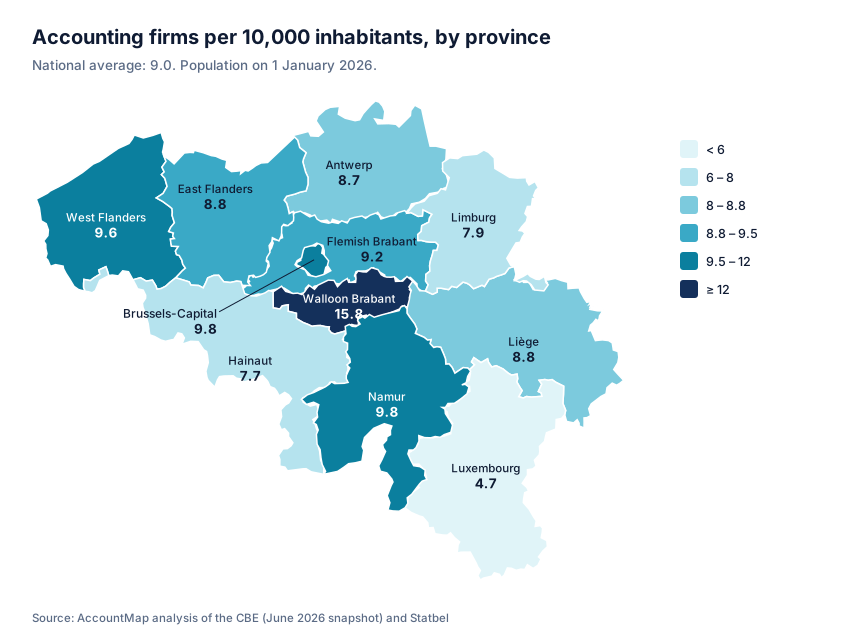
Walloon Brabant stands out clearly: 15.8 firms per 10,000 inhabitants, or one firm per 634 inhabitants. Together with Flemish Brabant, it is also one of the two provinces with the highest average income per inhabitant, and we will see below that this is no coincidence. Nine provinces then sit in a narrow band, between 7.7 and 9.8.
At the other end, the province of Luxembourg has one firm per 2,148 inhabitants, almost three and a half times fewer than Walloon Brabant. Income does not explain this gap: average income per inhabitant there is higher than in Namur, Liège or Hainaut. Hainaut and Limburg close the ranks of the "ordinary" provinces, with one firm per roughly 1,300 inhabitants.
The municipality rankings
Municipalities with the most firms
In absolute terms, unsurprisingly, the large cities dominate. Antwerp has 351 firms, Ghent 198, the City of Brussels 196, Liège and Charleroi 133 each, Anderlecht 131 and Namur 120.
| Municipality | Firms | Population | Firms per 10,000 inh. |
|---|---|---|---|
| Antwerp | 351 | 565,615 | 6.2 |
| Ghent | 198 | 274,042 | 7.2 |
| Brussels (city) | 196 | 198,674 | 9.9 |
| Liège | 133 | 198,102 | 6.7 |
| Charleroi | 133 | 206,900 | 6.4 |
| Anderlecht | 131 | 129,600 | 10.1 |
| Namur | 120 | 115,457 | 10.4 |
| Uccle | 103 | 87,548 | 11.8 |
| Bruges | 99 | 120,458 | 8.2 |
| Ixelles | 98 | 89,162 | 11.0 |
| Roeselare | 98 | 67,697 | 14.5 |
| Hasselt | 96 | 90,914 | 10.6 |
| Mons | 86 | 97,745 | 8.8 |
| Kortrijk | 79 | 81,523 | 9.7 |
| Molenbeek-Saint-Jean | 79 | 98,411 | 8.0 |
| Aalst | 77 | 93,094 | 8.3 |
| Waterloo | 75 | 30,386 | 24.7 |
| Schaerbeek | 68 | 129,278 | 5.3 |
| Sint-Niklaas | 66 | 83,400 | 7.9 |
| Mechelen | 66 | 90,355 | 7.3 |
Large cities fall below the average
Relative to their population, however, most large cities are below the national average. Antwerp has only 6.2 firms per 10,000 inhabitants, Charleroi 6.4, Liège 6.7, Leuven 5.4 and Schaerbeek 5.3. Only Namur, Anderlecht and the City of Brussels exceed the average.
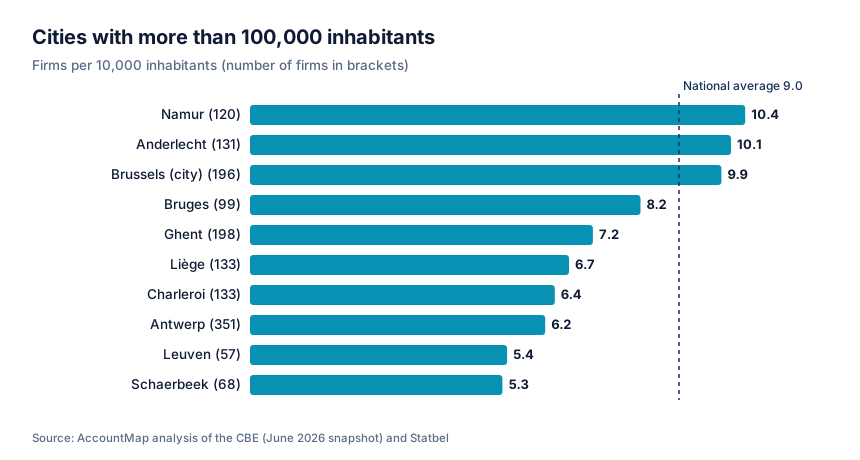
The explanation is simple. Accountants do not necessarily set up where their clients are: many sole traders and small accounting companies have their registered office at the manager's home address, in the residential municipalities around the cities. A client in Liège uses a firm in Chaudfontaine, a client in Antwerp a firm in Schilde or Zoersel.
The densest municipalities
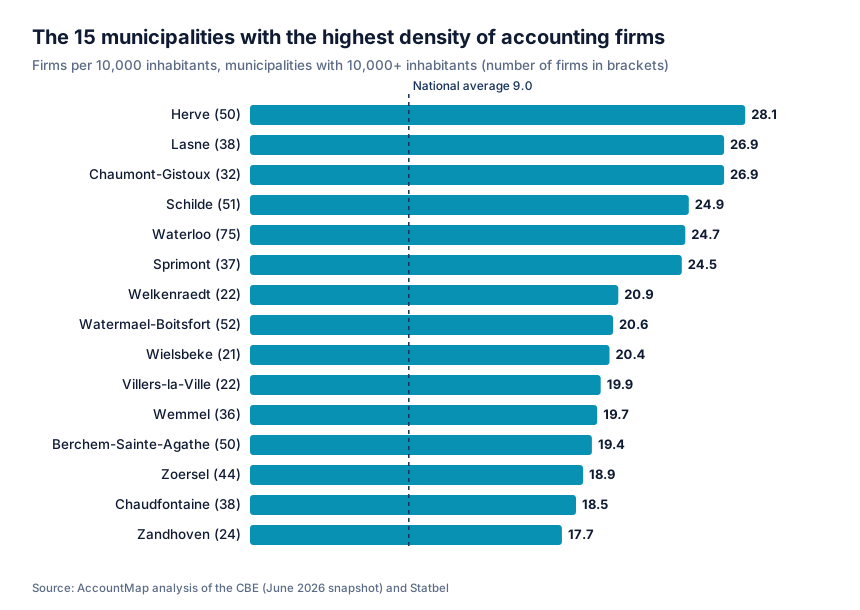
The ranking of the densest municipalities confirms this residential geography. It includes affluent municipalities in Walloon Brabant (Lasne, Chaumont-Gistoux, Waterloo, Villers-la-Ville), Antwerp's green belt (Schilde, Zoersel, Zandhoven), south-east Brussels (Watermael-Boitsfort) and the hills around Liège (Sprimont, Chaudfontaine).
Herve is a striking exception. With 50 firms for 17,822 inhabitants, or 28.1 per 10,000, it is the densest municipality in the country among those with more than 10,000 inhabitants. The phenomenon is recent: 20 of those 50 firms were created since 2020. Welkenraedt, also in the Herve area, is in the top 10 too.
The 19 Brussels municipalities
In Brussels, the gap between municipalities ranges from 1 to 4. Watermael-Boitsfort (20.6) and Berchem-Sainte-Agathe (19.4) lead by a wide margin, ahead of Koekelberg (15.1) and Auderghem (13.5). Saint-Josse-ten-Noode (5.9) and Schaerbeek (5.3) come last.
| Municipality | Firms | Firms per 10,000 inh. |
|---|---|---|
| Watermael-Boitsfort | 52 | 20.6 |
| Berchem-Sainte-Agathe | 50 | 19.4 |
| Koekelberg | 34 | 15.1 |
| Auderghem | 48 | 13.5 |
| Uccle | 103 | 11.8 |
| Ganshoren | 30 | 11.7 |
| Woluwe-Saint-Pierre | 47 | 11.0 |
| Ixelles | 98 | 11.0 |
| Anderlecht | 131 | 10.1 |
| Brussels (city) | 196 | 9.9 |
| Jette | 53 | 9.8 |
| Evere | 43 | 9.4 |
| Saint-Gilles | 45 | 9.2 |
| Woluwe-Saint-Lambert | 56 | 9.2 |
| Forest | 50 | 8.5 |
| Molenbeek-Saint-Jean | 79 | 8.0 |
| Etterbeek | 36 | 7.3 |
| Saint-Josse-ten-Noode | 16 | 5.9 |
| Schaerbeek | 68 | 5.3 |
The least served municipalities
Among municipalities with more than 20,000 inhabitants, Arlon is the least served in the country, with 8 firms for 31,440 inhabitants (2.5 per 10,000). It is followed by Blankenberge (2.9), Hoogstraten (3.1), Saint-Nicolas in the province of Liège (3.3), Colfontaine (3.4) and Tervuren (3.9). In Limburg, Lommel, Houthalen-Helchteren, Maaseik, Lanaken and Maasmechelen are all below 5.
The income effect: why some municipalities have more firms
The densest municipalities share a visible trait: they are often affluent. To check this, we crossed firm density with the average taxable income per inhabitant published by Statbel (2023 income), for the 486 municipalities with more than 5,000 inhabitants for which both figures exist.
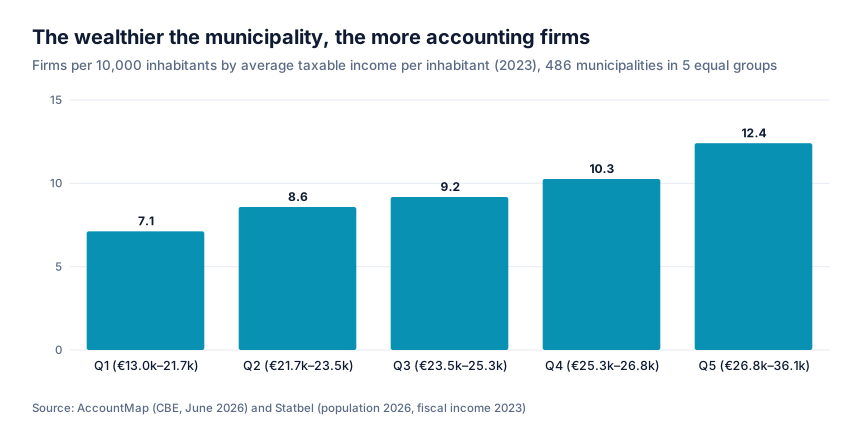
The link is clear and steady. The least affluent municipalities have 7.1 firms per 10,000 inhabitants, the most affluent 12.4, and each intermediate income band sits in between, in order. The rank correlation coefficient (Spearman) between income and density is 0.44 for the whole country: 0.40 in Flanders, 0.53 in Wallonia and 0.46 in Brussels.
Two mechanisms, which the data cannot tell apart, can explain it:
- Where accountants live. The profession is well paid, and many firms have their registered office at their founder's home. Accountants, like other liberal professions, tend to live in affluent municipalities.
- Demand. Affluent municipalities have more liberal professionals, company directors and assets to manage, so more clients for an accountant or a tax adviser.
For clients, the practical consequence is the same: supply is more plentiful in affluent residential municipalities than in city centres or working-class areas, where you often need to look a little further afield.
Municipalities without a firm
Of Belgium's 565 municipalities, 17 have no accounting firm based on their territory. Together they are home to about 70,000 inhabitants.
| Municipality | Province | Population |
|---|---|---|
| Aubange | Luxembourg | 17,845 |
| Niel | Antwerp | 11,059 |
| Attert | Luxembourg | 5,824 |
| Hotton | Luxembourg | 5,699 |
| Vleteren | West Flanders | 3,581 |
| Lincent | Liège | 3,419 |
| Burdinne | Liège | 3,300 |
| Baarle-Hertog | Antwerp | 3,103 |
| Trois-Ponts | Liège | 2,540 |
| Fauvillers | Luxembourg | 2,536 |
| Bever | Flemish Brabant | 2,279 |
| Martelange | Luxembourg | 2,142 |
| Rouvroy | Luxembourg | 2,097 |
| Herbeumont | Luxembourg | 1,731 |
| Daverdisse | Luxembourg | 1,397 |
| Mesen | West Flanders | 1,068 |
| Herstappe | Limburg | 78 |
Eight of these seventeen municipalities are in the province of Luxembourg. The most striking case is Aubange: nearly 18,000 inhabitants and not a single accounting firm. Together with Arlon, the least served municipality with more than 20,000 inhabitants, and Attert, Martelange or Fauvillers, the whole border strip with the Grand Duchy stands out.
A plausible hypothesis, which our data cannot prove, is the pull of neighbouring Luxembourg: part of the population works there, and so does part of the economic activity and of the accounting profession. Niel, in the province of Antwerp, is the other notable case: more than 11,000 inhabitants and only one statutory audit firm, with no accounting firm.
No firm does not mean no service. In every case, firms exist in neighbouring municipalities, and most accounting work is now largely handled remotely.
The age of firms: a profession that keeps renewing itself
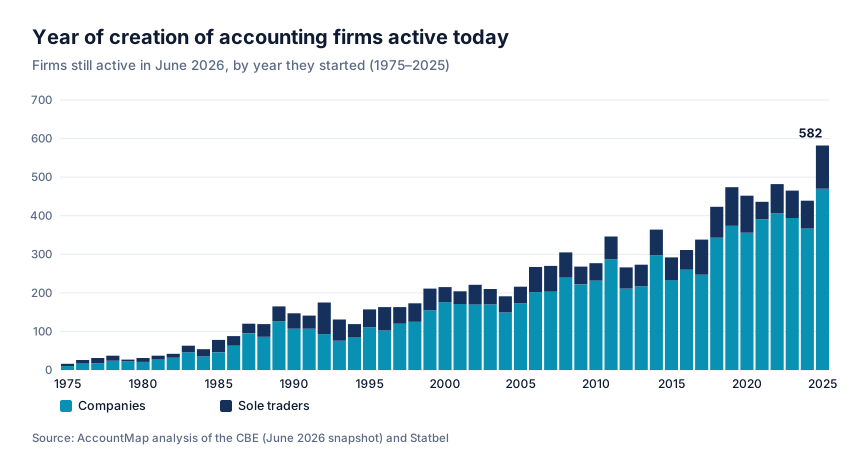
The median year of creation of active firms is 2012: half of them are less than fourteen years old. More than four in ten (42%) started in 2015 or later, and 2025 holds the record with 582 firms launched that year, twice as many as in 2015 (292).
| Age | Years of creation | Firms | Share |
|---|---|---|---|
| Under 5 years | 2021 and later | 2,469 | 21.9% |
| 5 to 9 years | 2016 to 2020 | 1,998 | 17.8% |
| 10 to 19 years | 2006 to 2015 | 2,928 | 26.0% |
| 20 to 29 years | 1996 to 2005 | 1,967 | 17.5% |
| 30 years and more | 1995 and earlier | 1,888 | 16.8% |
One caveat is needed. This chart does not show each year's creations, but the firms created that year that are still active today. Firms that closed, merged or were taken over no longer appear, which mechanically makes earlier years look thinner. Over a long period, the slope is therefore exaggerated.
Over the last ten years, however, when closures weigh little, the rise is real and affects all three regions. Between 2015 and 2025, the number of firms launched in the year went from 173 to 316 in Flanders, from 88 to 193 in Wallonia and from 30 to 69 in Brussels.
Part of this momentum comes from how people practise: more and more professionals work through their own company, even when they work within a larger firm. A new accounting company is therefore not always a new firm opening its doors to the public.
Sole trader or company, and which company
Companies take over
Among the firms created before 2000 that are still active, 30.5% operate as sole traders. That share falls to 20.7% for the 2000s, 19.7% for the 2010s and 16.6% for firms created since 2020. The company, with its limited liability and tax regime, has become the norm for setting up.
The SRL/BV dominates, the partnership limited by shares grows
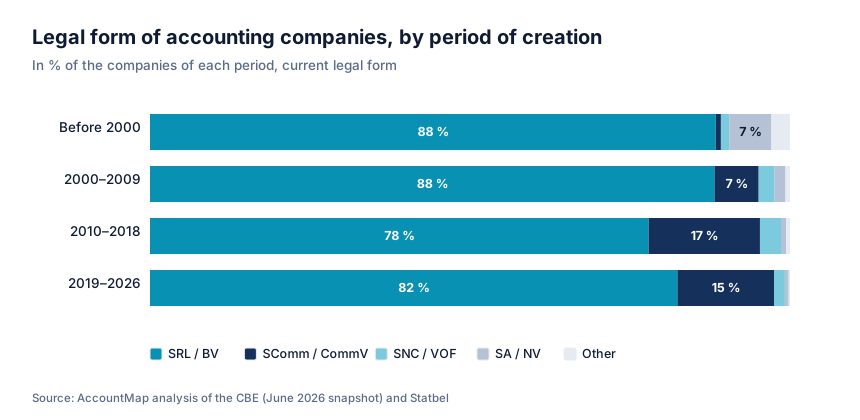
The SRL/BV, the private limited company that replaced the SPRL/BVBA under the 2019 Code of Companies and Associations, is the form of 84% of accounting companies (7,375 out of 8,811). But the SComm/CommV, the limited partnership, is growing: almost absent among firms created before 2000, it accounts for 15% of accounting companies created since 2019. Elsewhere it remains marginal; the general partnership (192 companies) and the public limited company (187) share the rest with a few cooperatives.
A profession of small practices
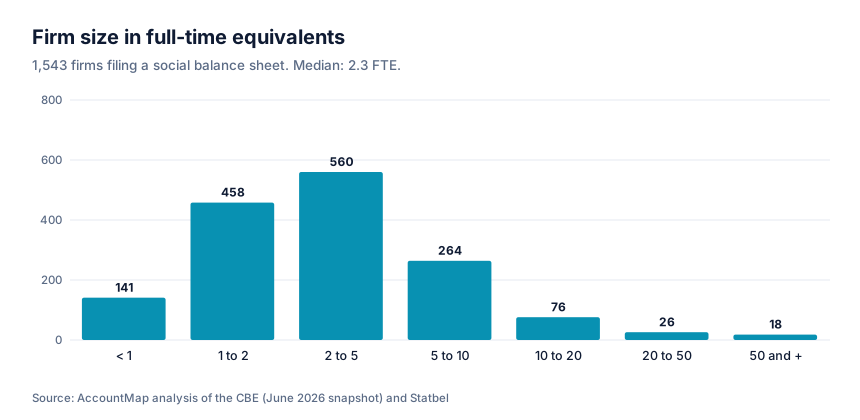
Firms with staff publish a social balance sheet with their annual accounts. 1,543 accounting firms do so, and their profile is unambiguous: the profession is made up of small practices.
| Size | Firms | Share |
|---|---|---|
| Under 1 FTE | 141 | 9.1% |
| 1 to 2 FTE | 458 | 29.7% |
| 2 to 5 FTE | 560 | 36.3% |
| 5 to 10 FTE | 264 | 17.1% |
| 10 to 20 FTE | 76 | 4.9% |
| 20 to 50 FTE | 26 | 1.7% |
| 50 FTE and more | 18 | 1.2% |
The median size is 2.3 full-time equivalents, and nine firms out of ten have fewer than 8.7 FTE. Only 44 accounting firms exceed 20 FTE. And these figures still overstate the real size of the sector: the roughly 9,700 firms that do not publish a social balance sheet mostly have no employees at all.
For clients, this matters. In the vast majority of cases, your accountant is a professional working alone or with a small team. Availability, continuity during absences and the quality of the relationship count for more than the brand.
The Big Four and the large networks
A third of employment in ten entities
At the opposite end of this fabric of small practices, a handful of entities concentrate a considerable share of employment. Of the 10,652 FTE declared by all accounting and audit firms that publish a social balance sheet, the ten largest entities employ 33%, and the Big Four entities alone 28%.
| Network | Accounting and audit entities counted | Declared FTE | Head office |
|---|---|---|---|
| Deloitte | 3 | 1,203 | Zaventem |
| EY | 7 | 746 | Diegem (Machelen) |
| PwC | 3 | 713 | Diegem (Machelen) |
| KPMG | 3 | 306 | Zaventem |
These figures only cover entities whose main activity is accounting, tax or audit. The Big Four employ far more people in Belgium through their consulting entities, which fall under other activity codes. One KPMG audit entity does not publish a social balance sheet in our data, which partly explains that network's lower figure.
A telling detail: all four have their head office in the same area, around Brussels Airport, in Zaventem and Diegem, in Flemish Brabant. BDO is based there too. This is one of the reasons why Flanders, home to 60% of accounting and audit companies, concentrates 76% of declared employment.
The other large employers
After the Big Four, the largest entities in the sector are SBB in Leuven (374 FTE for its accounting services company), BDO in Zaventem (198 FTE for accountancy, 175 for audit), Van Havermaet in Hasselt (113), PKF Bofidi in Ghent (100), Grant Thornton in Antwerp (82 for audit), Moore in Brussels (80 for audit), Fidiaz in Kortenberg (68), RSM Interfiduciaire in Zaventem (68), Konsilanto in Kontich (60) and Callens Vandelanotte in Kortrijk (57).
Office networks
Size is also measured by reach. 1,292 accounting firms, or 12.6% of those for which the information is available, have at least two establishments. The most extensive networks are Moore Finance & Tax (47 establishments), SBB (30), Fiducial Expertise (16), Moore Services Financiers (14), VGD (13) and Vandelanotte (12), ahead of BDO and Deloitte (11 each).
The financial health of accounting firms
Belgian companies file their annual accounts with the National Bank, where they are public. For 2,213 accounting companies, these accounts show the profit for the year, mainly for the 2024 financial year (1,774 companies) and 2025 (404). The figures below are medians: half of the companies do better, half do worse. No figure is published firm by firm.
| Indicator | Median value |
|---|---|
| Profit for the year | €74,600 |
| Equity | €176,400 |
| Balance sheet total | €507,400 |
| Cash | €68,100 |
| Solvency ratio | 40% |
The profession is profitable and sound. A quarter of accounting companies make less than €26,300 in profit, a quarter more than €176,900. Only 5.4% are loss-making and 2.7% have negative equity.
Brussels lags behind
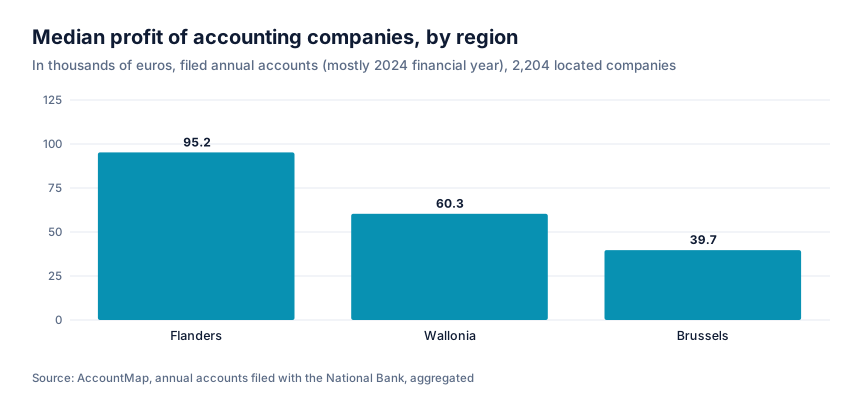
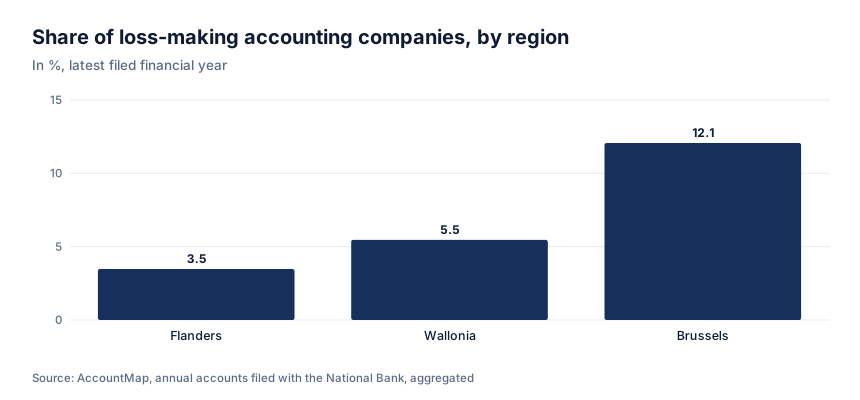
| Region | Companies analysed | Median profit | Median equity | Median solvency | Share loss-making |
|---|---|---|---|---|---|
| Flanders | 1,148 | €95,200 | €227,700 | 41% | 3.5% |
| Wallonia | 733 | €60,300 | €146,000 | 40% | 5.5% |
| Brussels | 323 | €39,700 | €111,100 | 38% | 12.1% |
The regional gaps are marked. The median profit of a Flemish accounting company is two and a half times that of a Brussels one, and the share of loss-making companies is more than three times higher in Brussels than in Flanders. Brussels firms are younger on average (median year of creation 2014, against 2012 elsewhere) and operate in a more competitive market, two factors that weigh on profitability.
Profitability follows size
| Size | Companies analysed | Median profit | Median solvency |
|---|---|---|---|
| Under 2 FTE | 599 | €61,600 | 47% |
| 2 to 5 FTE | 560 | €88,600 | 37% |
| 5 to 20 FTE | 340 | €190,900 | 29% |
| 20 FTE and more | 44 | €580,100 | 23% |
Profit logically rises with size, but solvency falls: large firms finance more of their activity with debt, often to buy client portfolios or other firms. Very small practices, on the other hand, build up equity.
What firms do on the side
1,435 accounting firms declare at least one secondary activity with the Crossroads Bank. By far the most frequent is management consultancy (663 firms). Next come office administrative and support services (268), other business support services (230), renting and operating real estate (221), legal activities (88), holding companies (76) and training (69).
This confirms a well-known shift in the profession: accountants no longer limit themselves to bookkeeping and tax returns. They advise, handle their clients' administration, train, and sometimes invest their own reserves in property.
At the ITAA: a profession reshaping itself
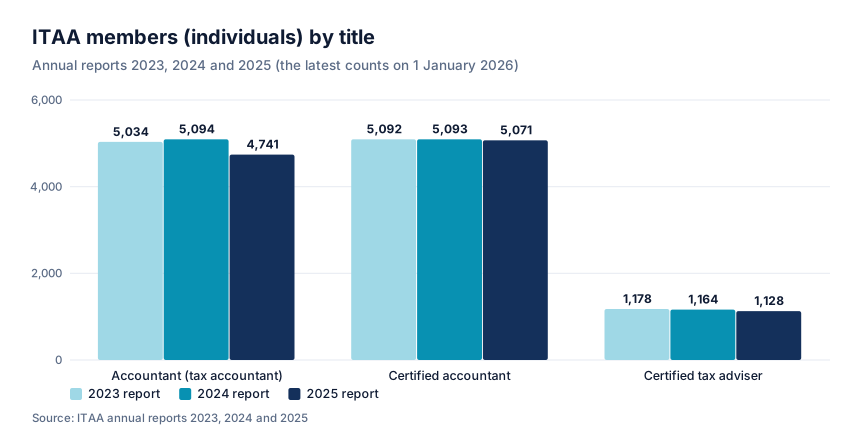
The ITAA's annual reports provide the other half of the picture, that of qualified professionals. They show a slight fall in membership, but one that does not mean what you might think.
| Title | 2023 report | 2024 report | 2025 report |
|---|---|---|---|
| Accountant (tax accountant) | 5,034 | 5,094 | 4,741 |
| Certified accountant | 5,092 | 5,093 | 5,071 |
| Certified tax adviser | 1,178 | 1,164 | 1,128 |
| Total members | 11,304 | 11,351 | 10,940 |
Between the 2024 and 2025 reports, membership fell from 11,351 to 10,940, a drop of 3.6%. But most of the drop, 353 members out of 411, comes from a single title: accountant (tax accountant). Certified accountants are stable at around 5,070.
This title is the one held by the former certified bookkeepers and tax accountants of the IPCF/BIBF, taken over by the ITAA when the two institutes merged in 2020. As our entry on the tax accountant explains, these former titles are being phased out: those who hold them keep them, but they are no longer granted to new candidates. The number of holders can therefore only fall as people leave, with no new entrants under the same title to replace them.
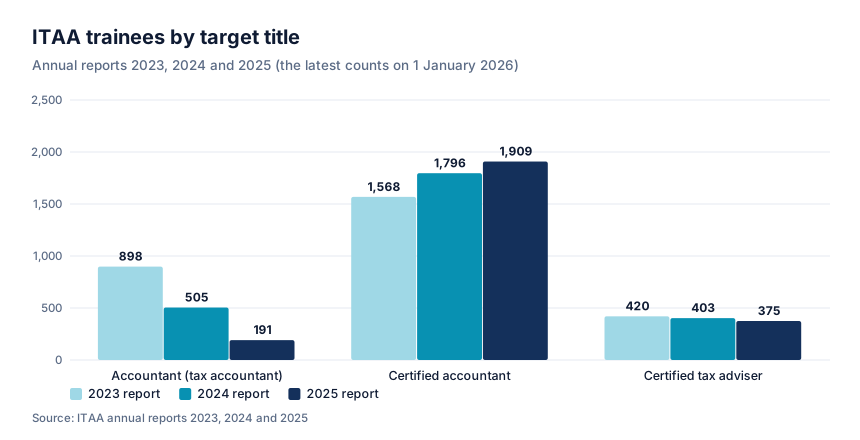
The trainee figures confirm the trend. Trainees aiming for the accountant (tax accountant) title fell from 898 to 191 over two reports, while certified accountant trainees rose from 1,568 to 1,909, 22% more. The total number of trainees is falling (from 2,886 to 2,475), but that is the effect of one pathway being phased out, not of people turning away from the profession.
The overall picture is therefore not of a profession emptying out, but of one reshaping itself around the more demanding certified titles. It also remains mostly Dutch-speaking: 6,746 Dutch-speaking members (62%) against 4,194 French-speaking (38%), a split close to the demographic weight of the two communities.
How many businesses per accountant?
Belgium had 1,202,139 VAT-registered businesses at the end of 2025, according to Statbel. Divided by the 8,959 ITAA professionals working for clients, that gives about 134 businesses per professional. Divided by the 11,250 firms, about 107 businesses per firm.
These ratios are orders of magnitude. Not all VAT-registered businesses use an external accountant, and many firms rely on unqualified staff. They nonetheless give an idea of the workload on the profession, and explain why some firms now limit new client intake, especially for very small files.
What these figures mean when looking for an accountant
This panorama has very concrete consequences when you are looking for an accountant.
- Look beyond your own municipality. In large cities, supply is proportionally lower than in the suburbs. A firm in the next municipality is often just as accessible, and most exchanges now happen remotely.
- Don't necessarily look for a large firm. Three firms out of four have fewer than five people. A well-organised small firm often offers a more direct relationship than a large one, provided you check how it handles absences and busy periods.
- Check ITAA registration. A business can declare an accounting activity with the Crossroads Bank without its managers holding a protected title. The ITAA public register lets you check in seconds whether a professional is registered, and under which title.
- Choose the title that fits your needs. For everyday bookkeeping, an accountant, certified or not, will do. For some statutory assignments, such as a contribution in kind, you need a certified professional or a statutory auditor. Our guide on the difference between an accountant and a tax accountant details these cases.
- Put the relationship in writing. Whatever the size of the firm, a written engagement letter sets the scope and the fees. For typical prices, see our guide on how much an accountant costs.
To find a firm near you, the AccountMap directory and the interactive map list firms by municipality, with dedicated pages for Brussels, Antwerp, Ghent, Liège, Namur, Bruges and Kortrijk, as well as for each province. And if you are thinking of leaving your current firm, our guide to changing accountant explains the procedure.
Methodology and limitations
Sources
- Crossroads Bank for Enterprises (CBE): active businesses whose main activity falls under NACE-BEL codes 69.201 to 69.203, snapshot of 18 June 2026. Data used: legal form, legal status, start date, address, establishments, secondary activities.
- Annual accounts filed with the National Bank of Belgium: profit, equity, balance sheet total, cash and solvency for 2,213 accounting companies; social balance sheet (full-time equivalents) for 1,543 accounting firms. These data are only used in aggregate form.
- Statbel: population by municipality on 1 January 2026, fiscal income by municipality (2023 income), number of VAT-registered businesses at the end of 2025.
- ITAA: 2025 annual report (figures on 1 January 2026), 2024 annual report and 2023 annual report.
Scope
- Excluded: VAT units (50), businesses in bankruptcy, liquidation, dissolution or judicial reorganisation (53) and firms whose main activity is statutory audit (906).
- Each firm is counted once, at the address of its registered office (companies) or first establishment (sole traders). Any branch offices are not counted in the municipalities where they are located.
- Densities are calculated on the 10,692 located firms, set against the population of each area. Municipalities merged on 1 January 2025 are treated within their new boundaries.
- The correlation with income covers the 486 municipalities with more than 5,000 inhabitants whose 2023 income is published under the same municipality code.
Limitations
- The activity code is declared by the business itself. A business may have chosen the wrong code, or practise accounting as a secondary activity, and escape the count.
- The number of firms is not the number of accountants: a firm can bring together dozens of professionals, and an accounting company may be no more than the vehicle of a professional working within another firm.
- The year of creation only describes firms that are still active: firms that disappeared do not appear, which underestimates creations in earlier years.
- Financial and employment data only cover companies that publish this information, which are larger on average than the others. The medians therefore describe those companies, not the whole sector.
- ITAA figures come from reports whose counting date may vary from year to year; they are reproduced as published.
This panorama will be updated every year. If you spot an error or wish to reuse these figures, please cite "AccountMap, 2026 panorama of accounting firms in Belgium" with a link to this page.